Oracle Predictive Analytics
Machine learning model builder
SnapshotRole Scope Outcome Stack | ||
Sole designer on the predictive model builder inside Oracle Advanced Analytics (now Oracle Machine Learning).
This predictive model builder lets data scientists build, tune, and deploy predictive models against enterprise data.
Users can built three classes of R-based predictive models, association rules, decision trees, and linear regressions, then deployed them into Oracle's live operational dashboards and alerts.
One model builder pattern to support three models
The model builder, the feature I designed, was where data scientists actually built their models. R was the language. And the three models supported in the MVP were:
Association Rules, "customers who buy this also buy that
Decision Tree, for classification problems with categorical or numeric inputs
Linear Regression, for predicting continuous outcomes from weighted inputs
Each model has its own statistical mechanics, its own diagnostic vocabulary, and its own ways of going wrong. The model builder had to handle all three coherently.
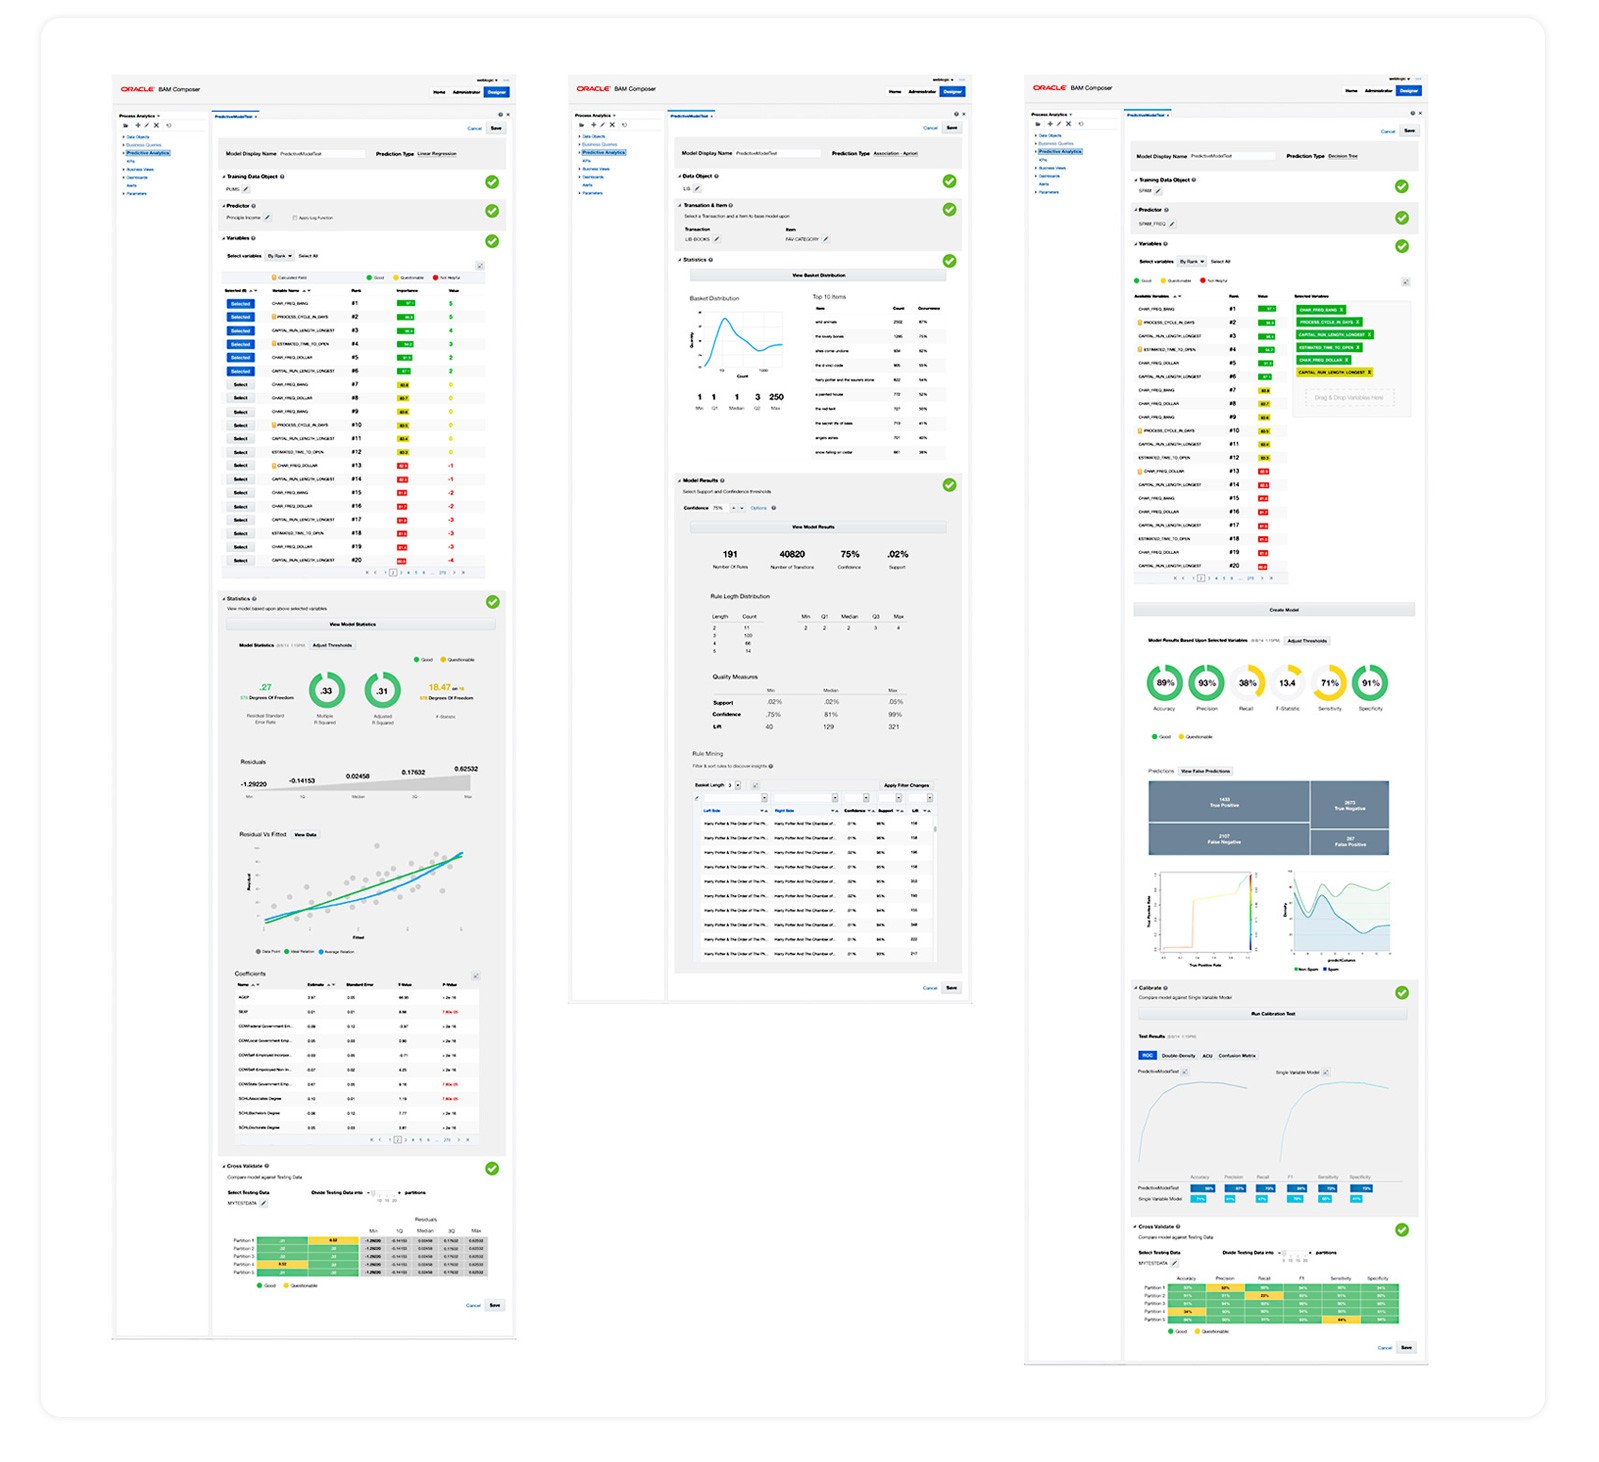
Linear Regression, Association Rules, Decision Tree
Designed for data scientists
This was not a low-code product. The primary user was a data scientist who could write R, fluent in statistical modeling, comfortable with the math, and unwilling to tolerate an interface that abstracted away the mechanics.
Manning's Practical Data Science with R was the era's standard reference, the kind of book this user had on their desk. The builder had to feel native to that mental model. And that constraint shaped every design decision.
A data scientist using a tool like this needs:
Visibility into the model
They want to see coefficients, residuals, confidence intervals, feature importance, all the diagnostics that tell them whether the model is any good.Control over the model
They want to tune hyperparameters, swap variables, control feature selection, and override defaults.Reproducibility
Every run needs to be repeatable, traceable, and comparable to previous runs.
Designing for this user meant resisting two common pitfalls in ML tool design:
Oversimplifying, which makes experts feel patronized.
Overexposing, which dumps every parameter on screen and overwhelms even an expert.
Progressive disclosure & diagnostic visualizations
Choosing and tuning models to perform to expectations is a cumbersome, anxiety-inducing task.
A data scientist sits down with thousands of variables, dozens of decisions, and an open question: will this model actually be any good?
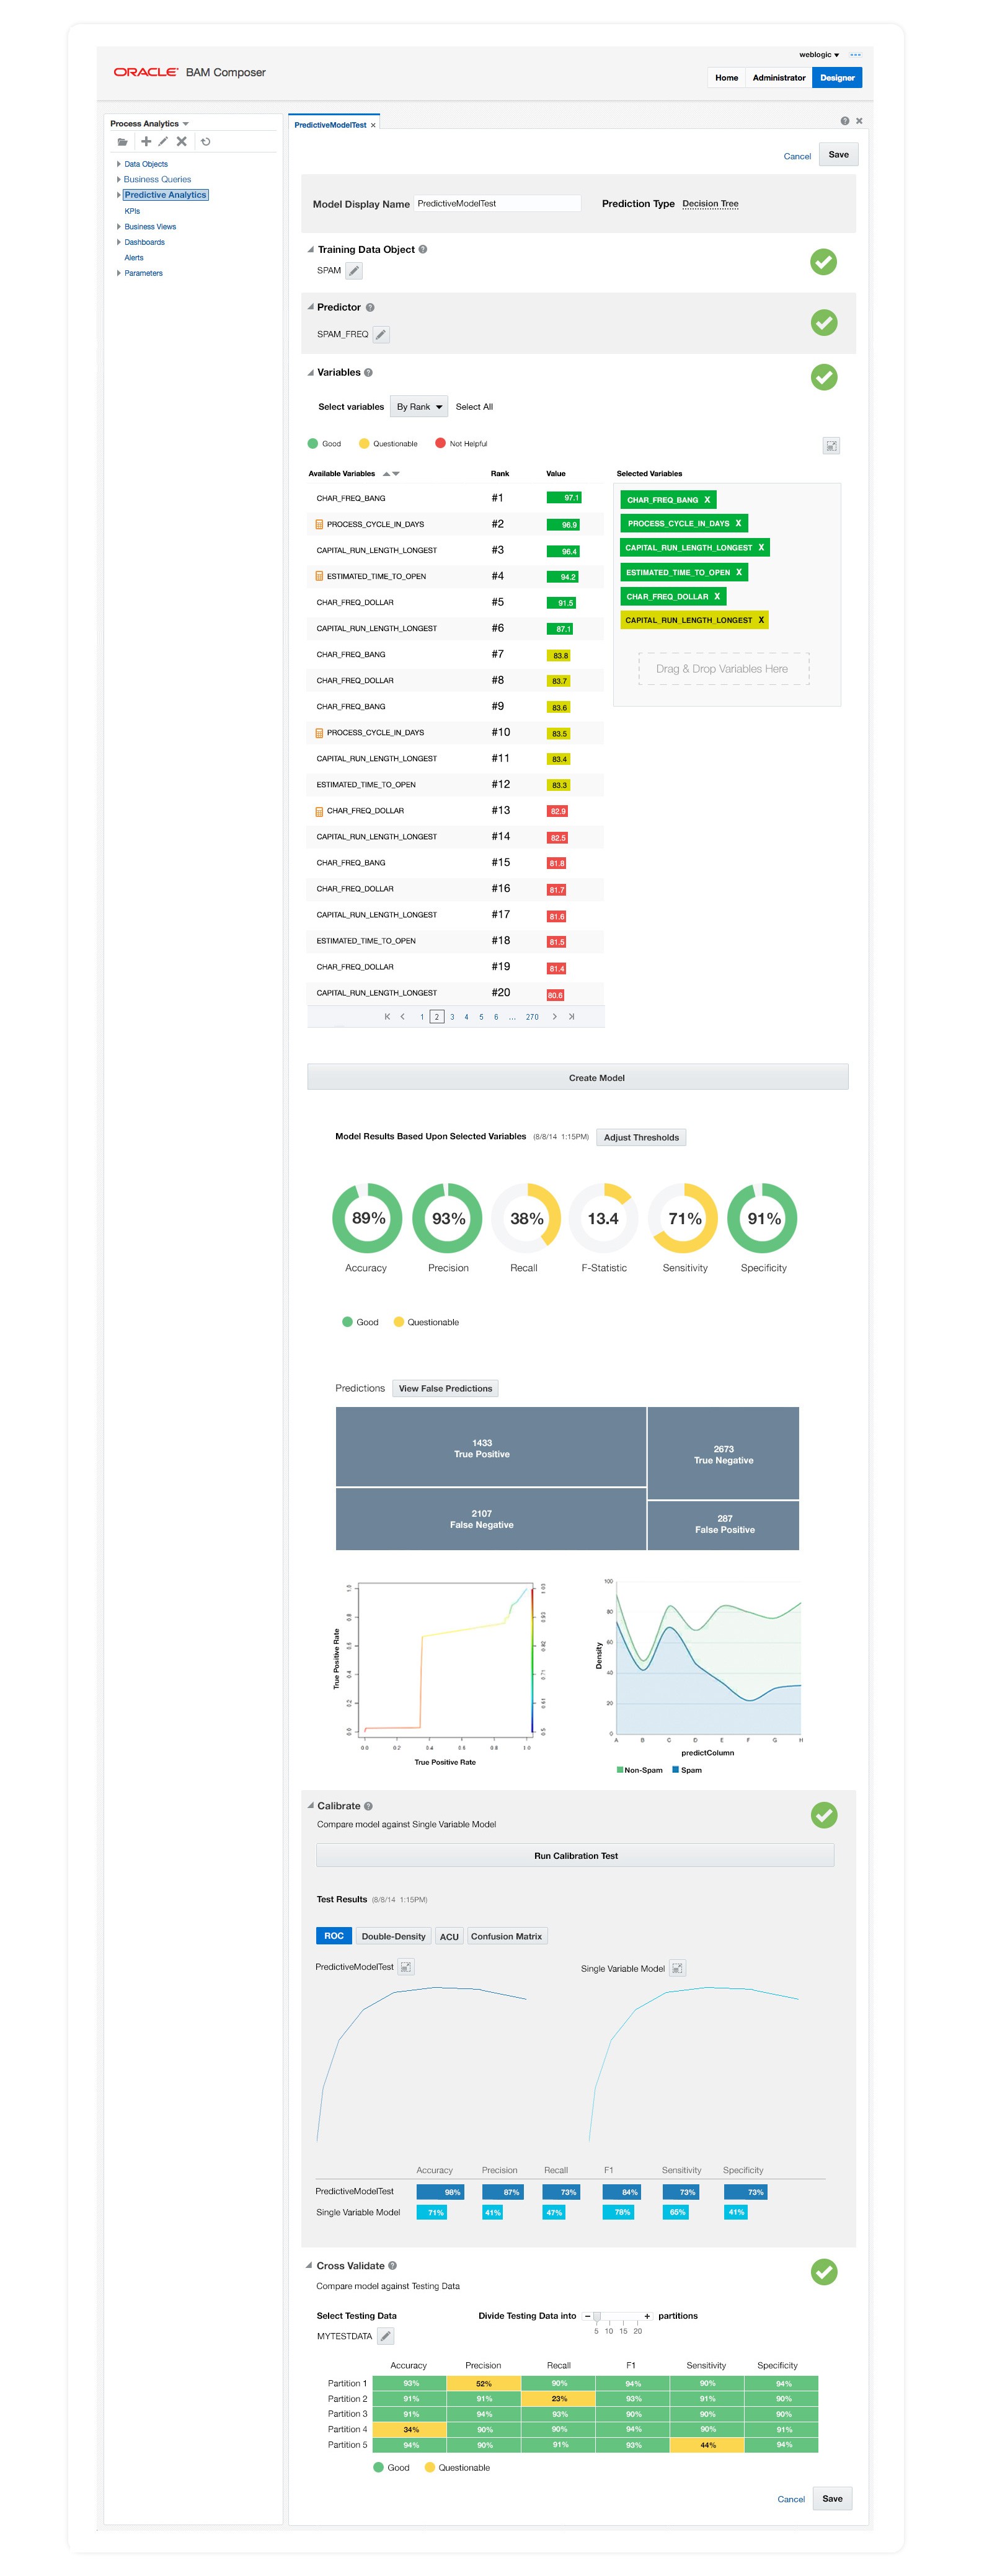
The 0-to-1 design strategy answers that question incrementally. Rather than presenting every option at once, the model builder uses progressive disclosure to break model tuning into a sequence of smaller sub-tasks, each one validated by a diagnostic visualization before the user moves to the next.
Confidence builds as the user progresses, by the time they reach the deploy decision, they've seen the model proven across multiple checkpoints.
The common pattern that repeats across all three model types include:
Choose Training Data
Choose Predictor
Select Variables
Run Model
Inspect Predictions
Calibrate
Cross Validate
Save / Deploy
Each step has its own checkpoint indicator (a green check) that visibly fills in as the user completes each step.
The interface communicates progress. A complex statistical workflow becomes a guided experience without ever talking down to the user.
Decision Tree model builder
Contextual variance
The three statistical methods don't share a common diagnostic vocabulary,
Decision trees report accuracy and confusion matrices
Linear regressions report R-squared and residuals
Association rules report support and confidence
Designing one coherent product across three different statistical universes required choosing which patterns to generalize and which need to vary contextually.
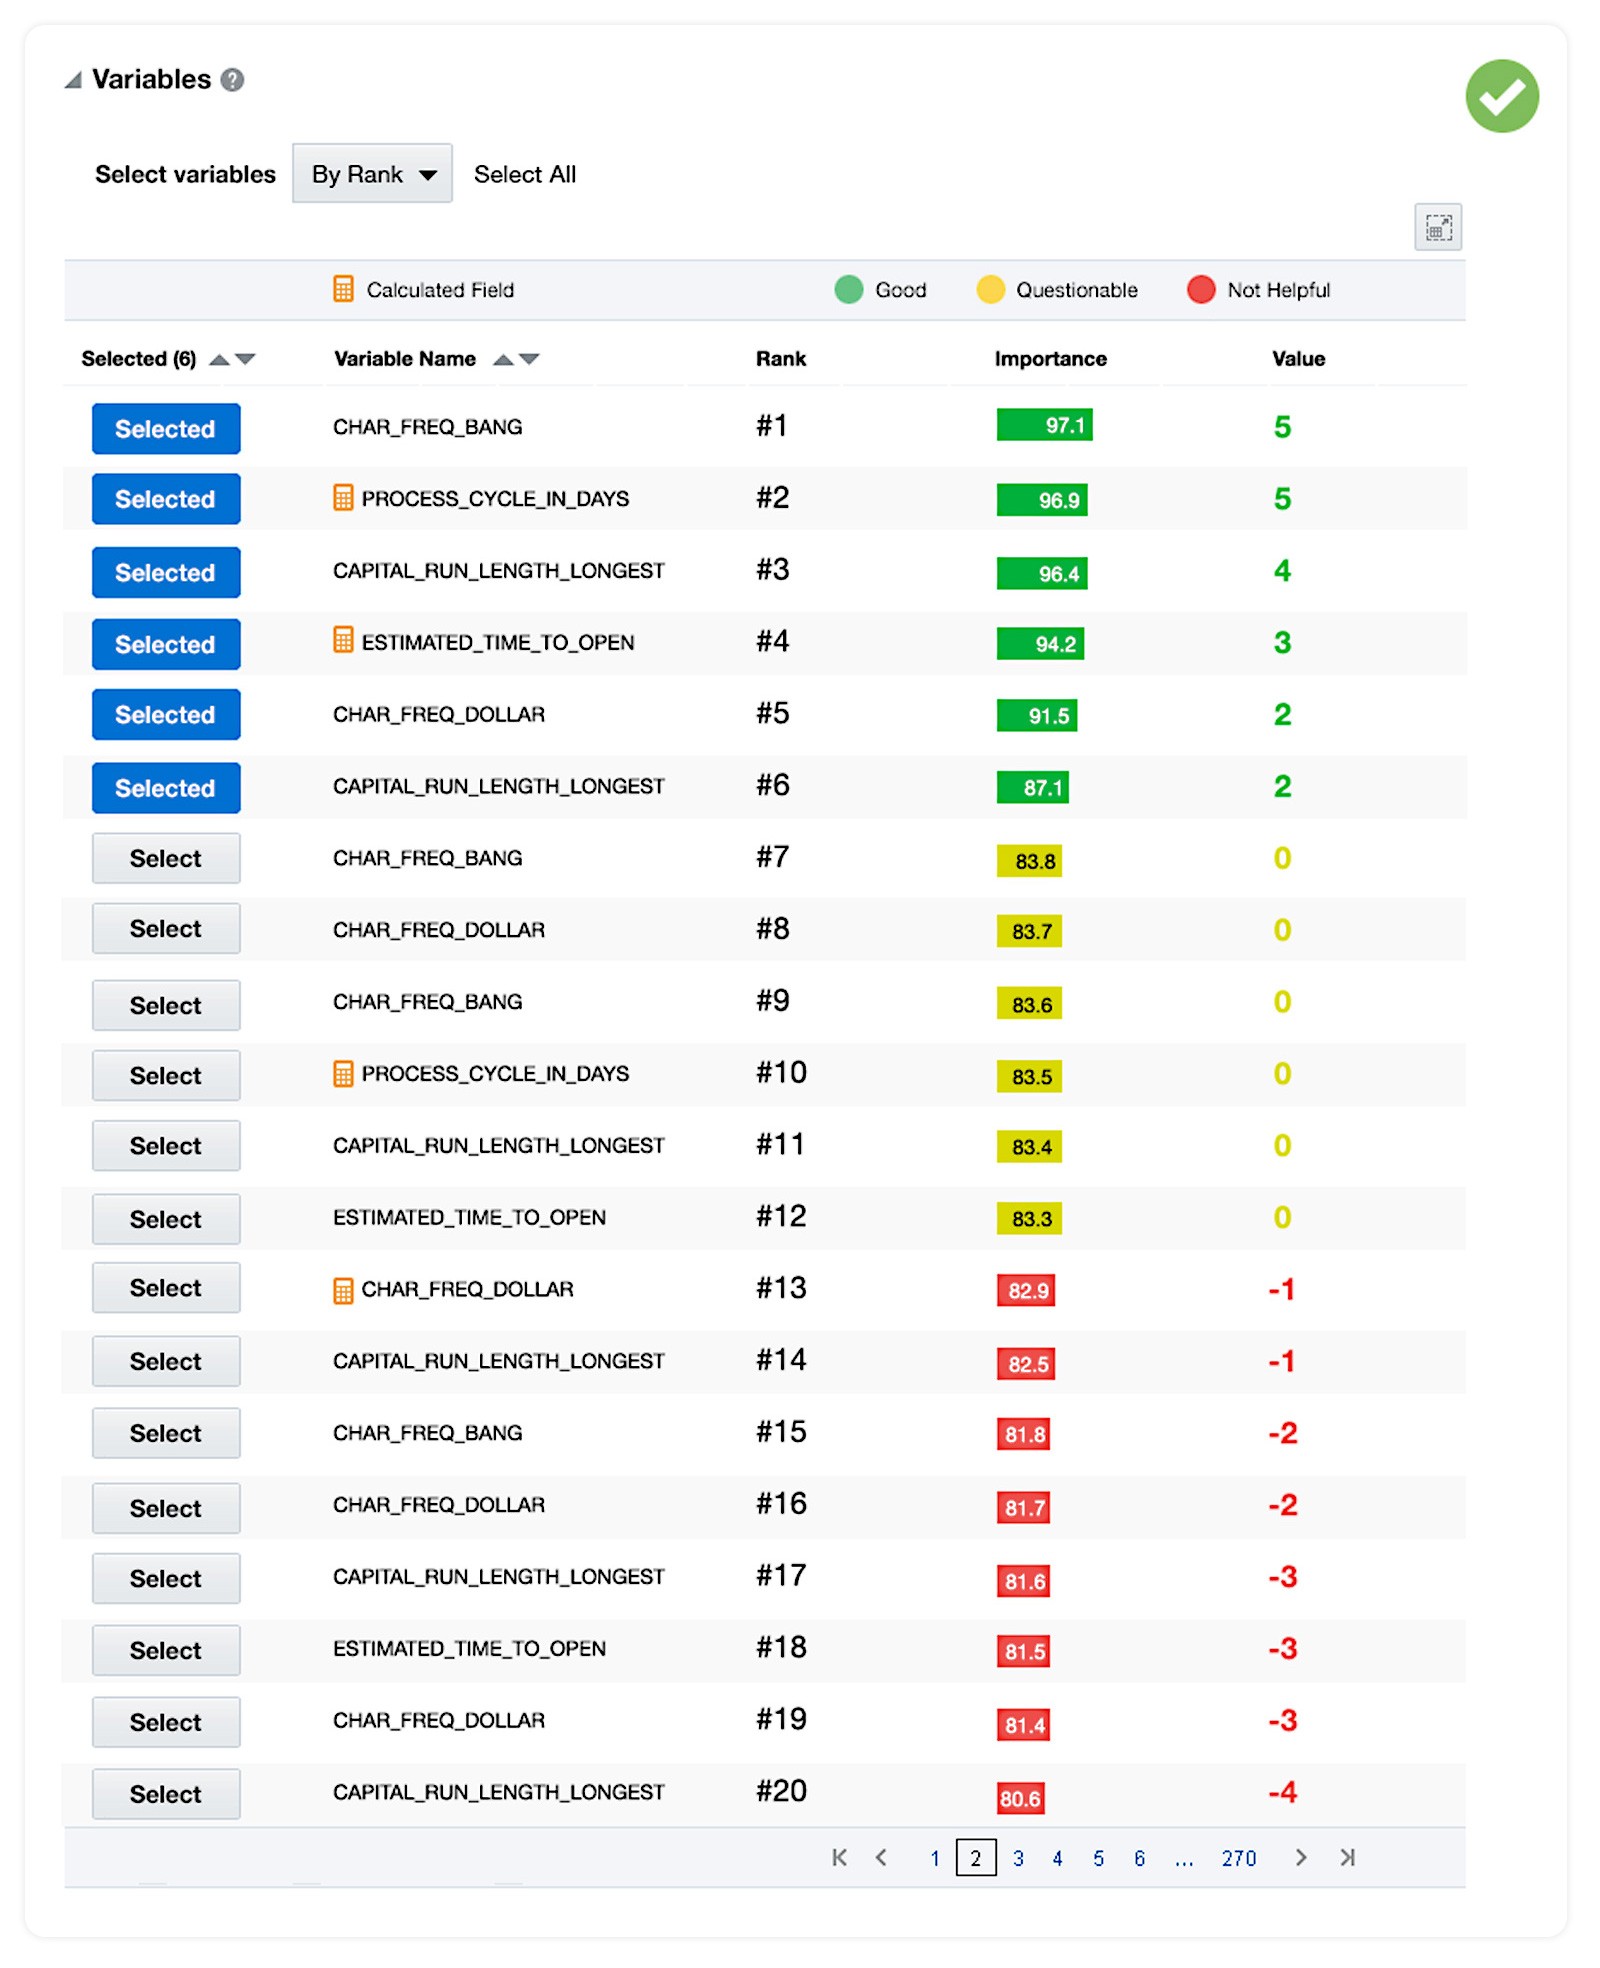
A generalized pattern: variable selections
For Decision Tree and Linear Regression, variables are surfaced in a ranked list with a Good, Questionable, Not Helpful color treatment based on importance score.
The user can sort by rank, select a subset, and immediately see which variables made the cut.
Selecting Decision Tree variables
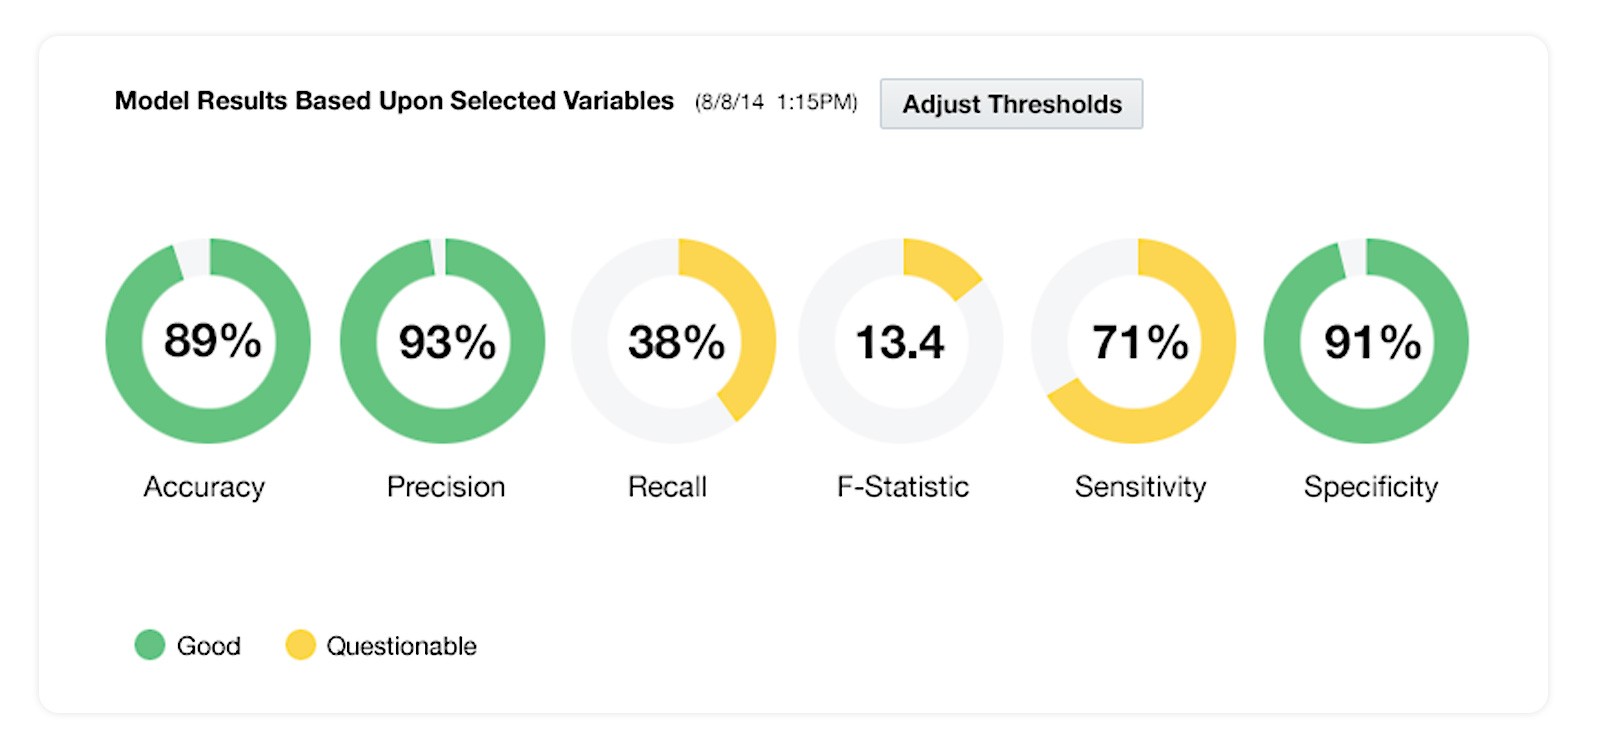
A contextually variant pattern: diagnostic ring charts
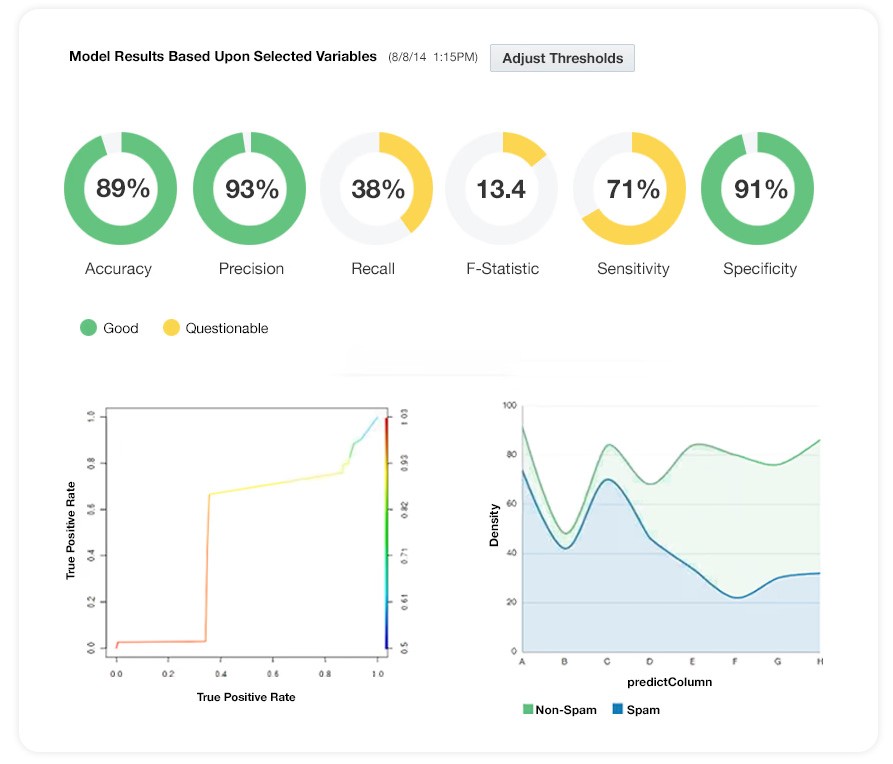
Once a model runs, the diagnostic surface is six ring charts: Accuracy, Precision, Recall, F-Statistic, Sensitivity, Specificity.
Each ring is a percentage. A data scientist can scan all six rings in two seconds and know whether the model is in good shape or needs work.
Decision Tree diagnostic charts
Model specific diagnostics
Where the math diverges, the design diverges.
Linear Regression surfaces residual standard error, multiple R-squared, adjusted R-squared, F-statistic, residuals min/median/max, and a residual-vs-fitted plot, all the diagnostics a regression-literate user expects.
Association Rules surfaces basket distribution, top items, number of rules, confidence threshold, support, lift, rule length distribution, and a rule-mining table with sortable left-side, right-side, confidence support, lift columns.
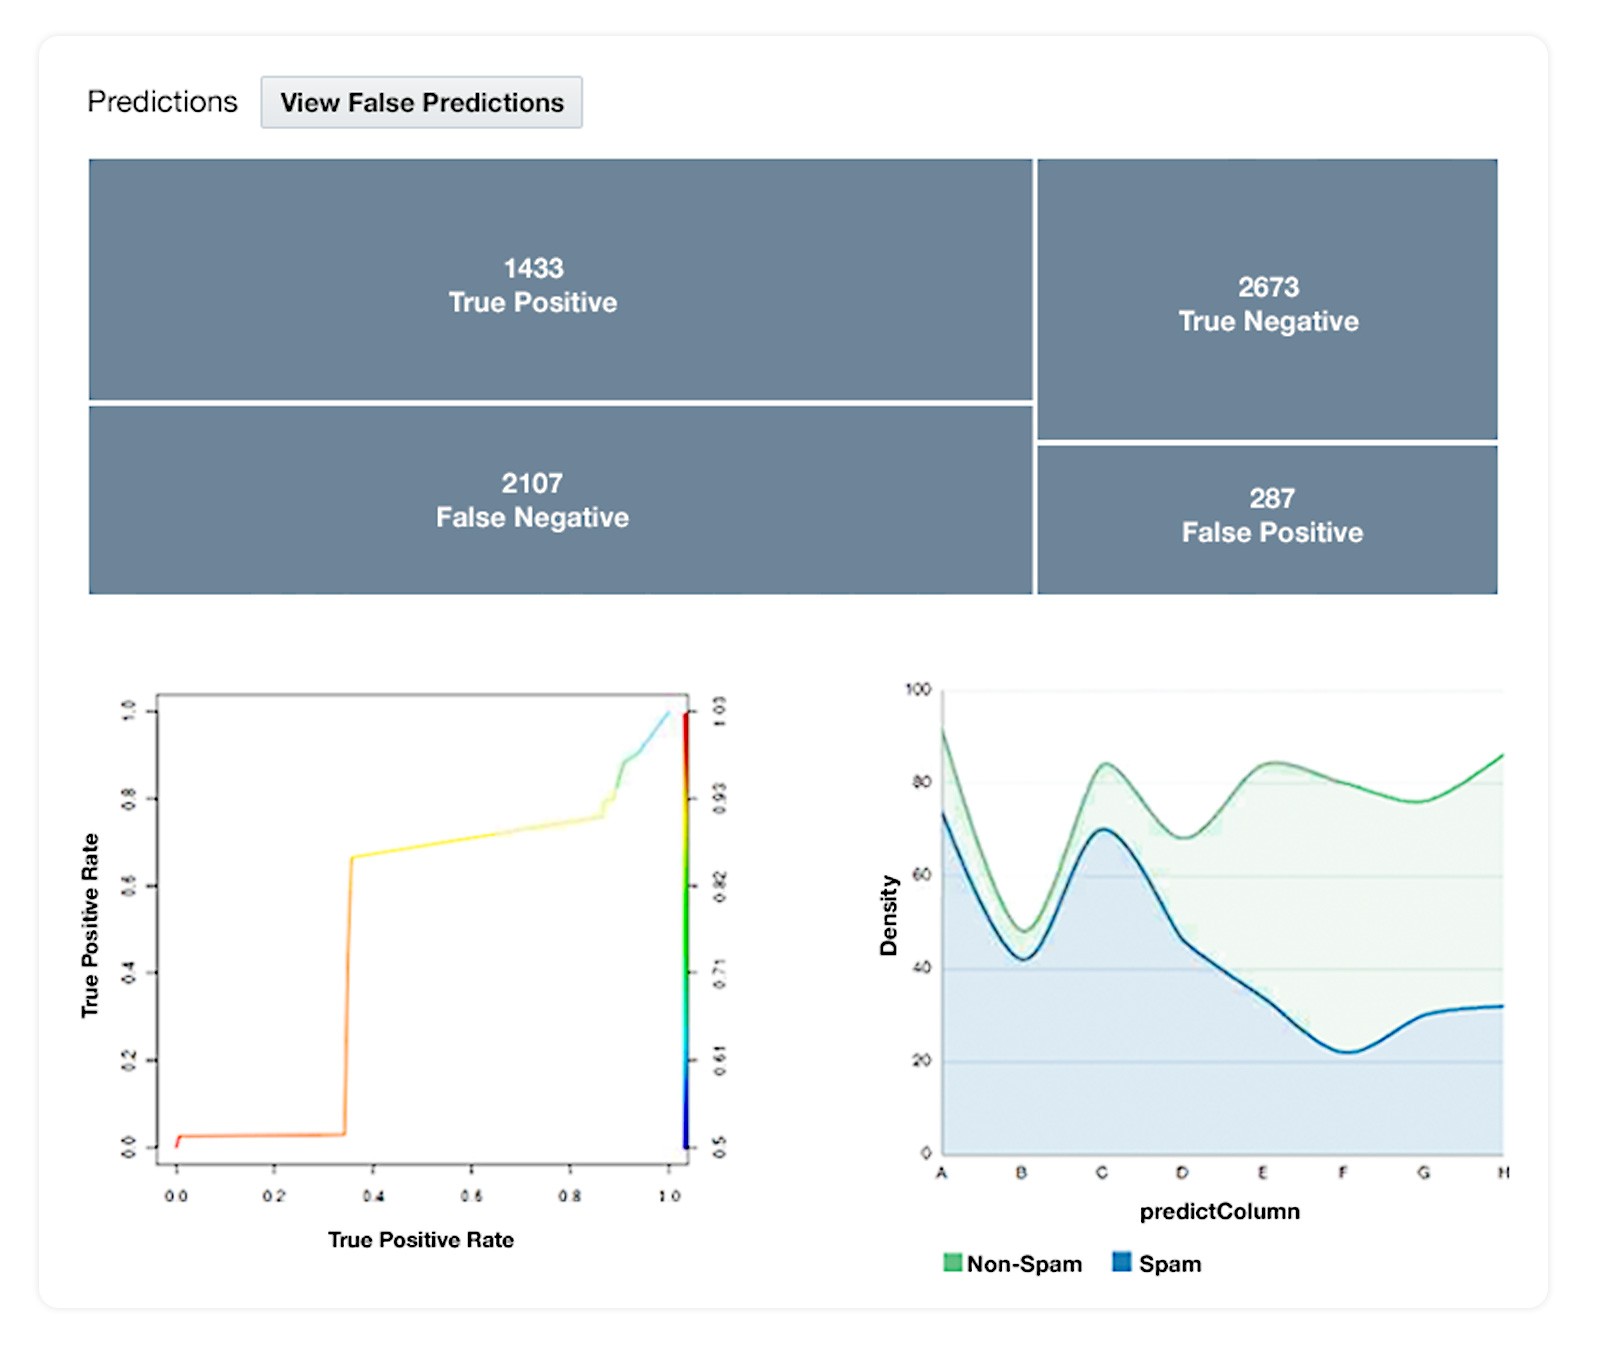
Decision Tree measures false prediction, and uses a four-quadrant true/false positive/negative matrix.
Each method gets the diagnostics its statistical framework actually needs. The progressive-disclosure shell is shared, and the contents are model specific.
Decision Tree: false prediction diagnostics
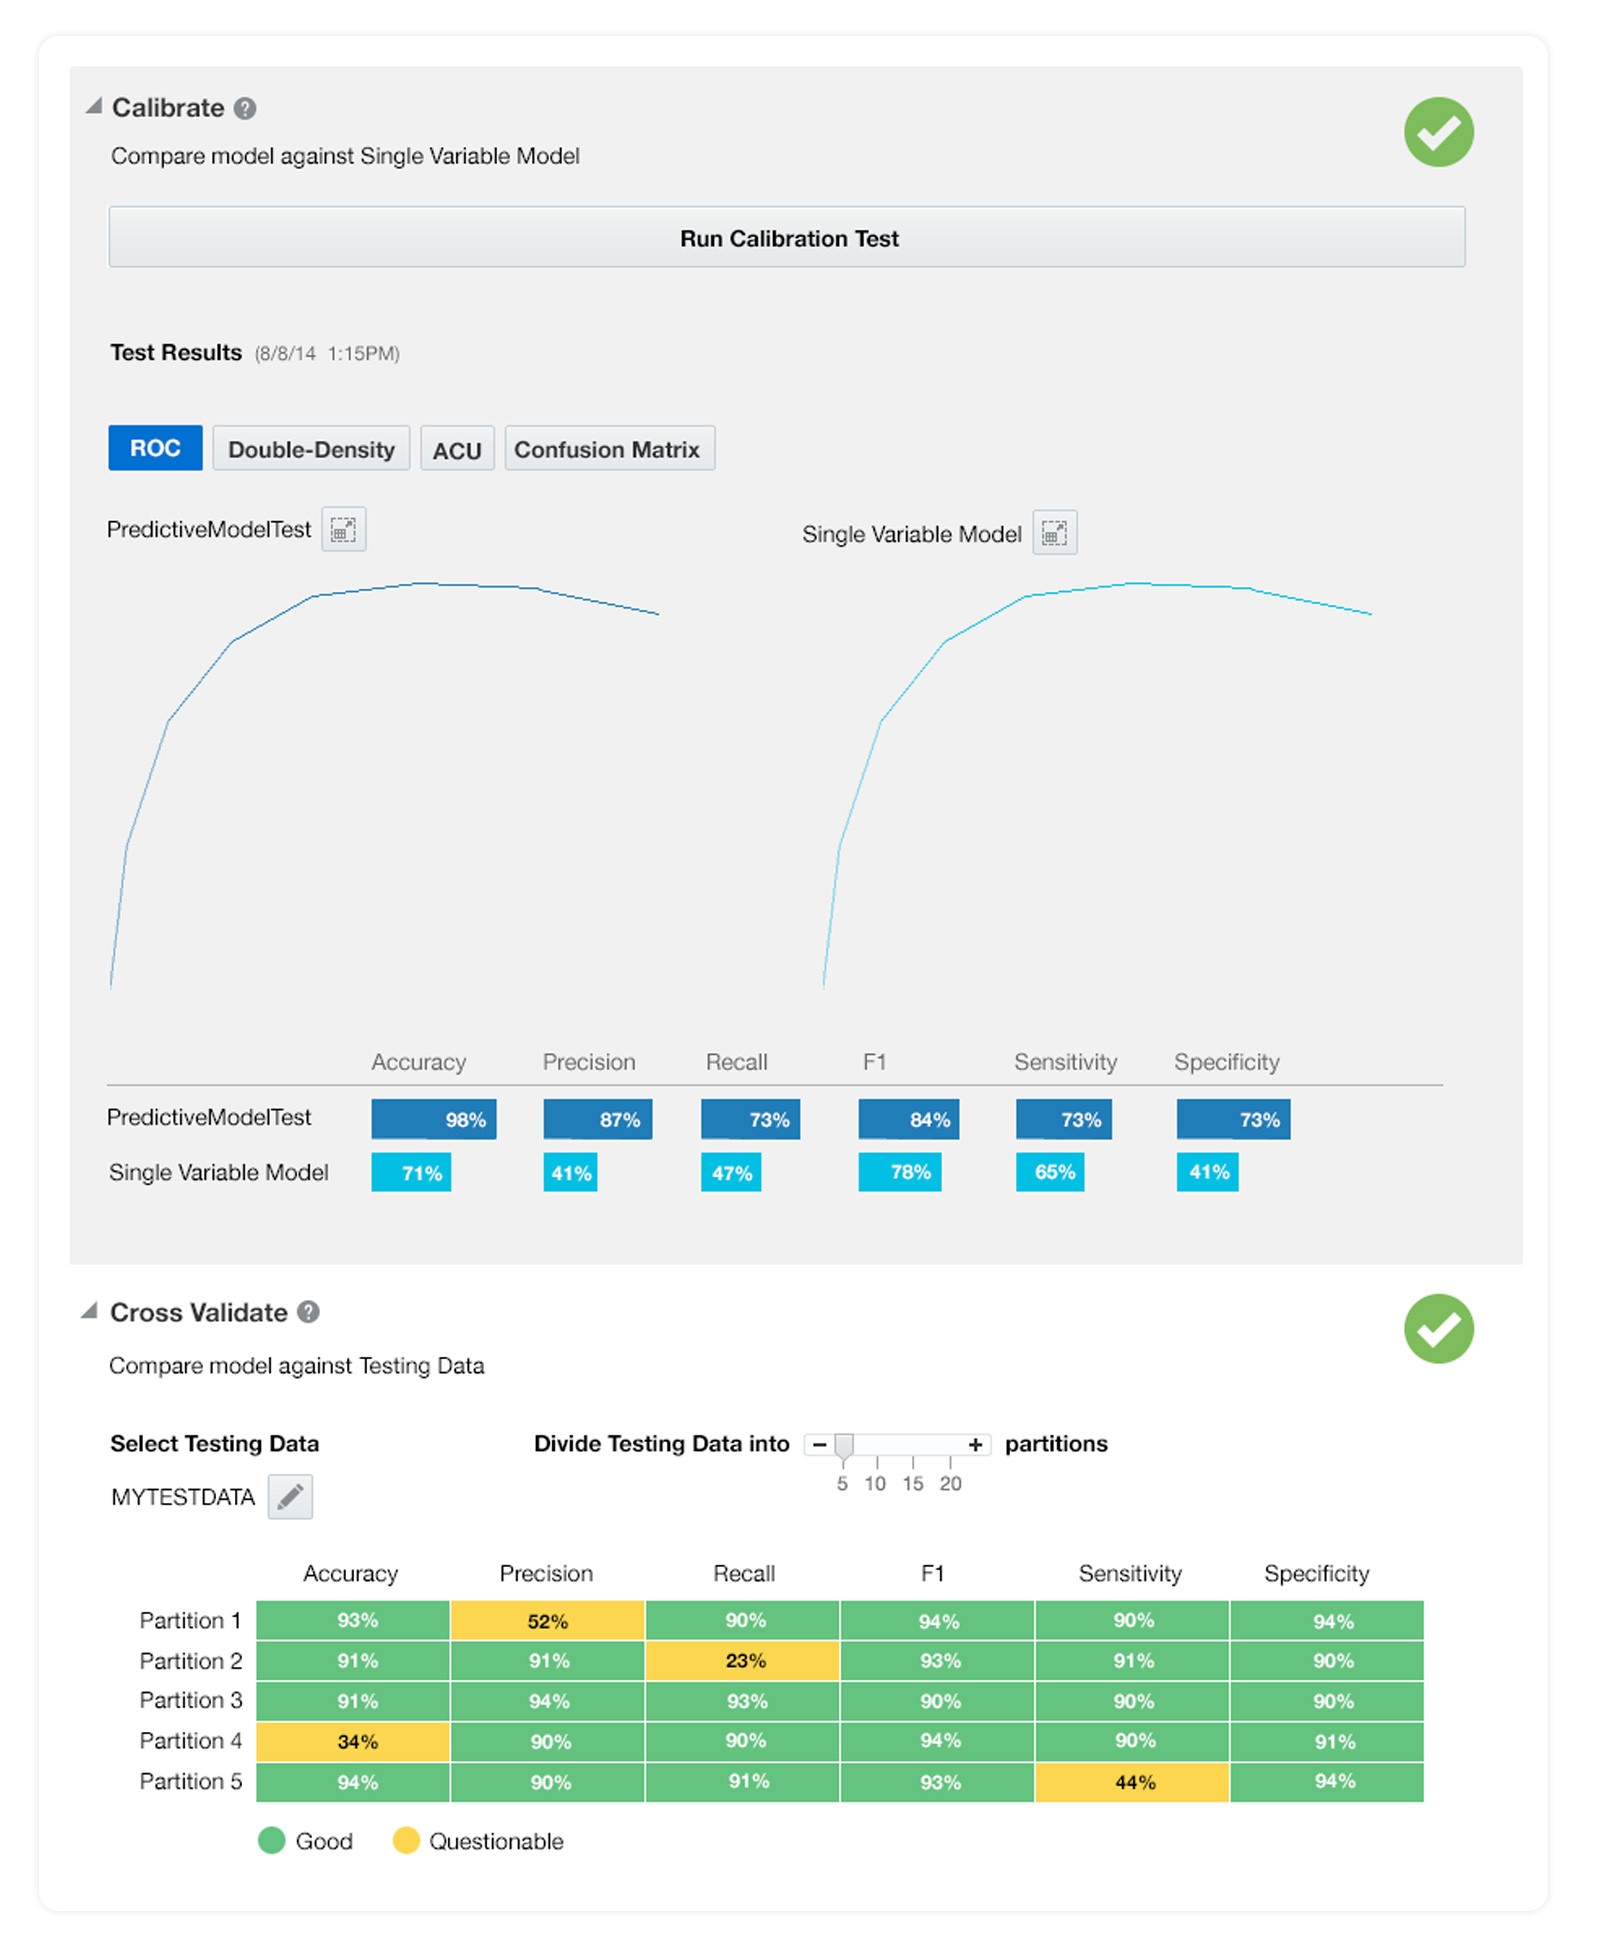
Calibrate & Cross Validate
The two final steps before deployment:
Calibrate, comparing against a Single Variable Model baseline
Cross Validate, partition the test data and check consistency
Each are explicitly framed as confidence-building. They answer the data scientist's last anxiety:
"Am I sure this model is actually working?"
"Does it hold up on data it hasn't seen?"
Decision Tree calibration & validation
Team structure
I was the sole designer, partnered up with a Director of Engineering (data scientist & R specialist) and an engineering lead (representing the team building the product).
Outcome
Predictive Analytics shipped inside in 2019 Oracle Advanced Analytics (now Oracle Machine Learning), and used by customers that include JPMorganChase, Mercedes Benz, and Walmart.
Why this work matters
In 2019, I designed for a user who would not tolerate abstraction, a data scientist who wrote R, read residual plots, and wanted the mechanics visible. The challenge was scaffolding a complex workflow without ever talking down to the expert.
That's the same job AI-forward companies are hiring lead designers for in 2026. The user has evolved, now more of a generalist and/or consumer, but they're confronted with the same problems an expert faced eleven years ago:
Is this output any good?
The consumer needs to evaluate a model's answer without a statistics background. Citations, confidence signals, and "show your work" patterns are the modern equivalent of a residual plot.
How do I steer it?
The consumer needs to shape output without writing code. Prompt suggestions, regenerate controls, and tone/length toggles are doing the job hyperparameters used to do.Can I trust it with something that matters?
The consumer needs to commit to a model's output for real decisions. Preview states, undo, and human-in-the-loop checkpoints are the new calibration step.
Eleven years of designing for users who collaborate with models. The interface changed. The user changed. The design methodology didn't.